Dashboards
Dashboards group several reports and present them on a single page. In SeekTable, dashboards are defined by an HTML template that can contain special placeholders for:
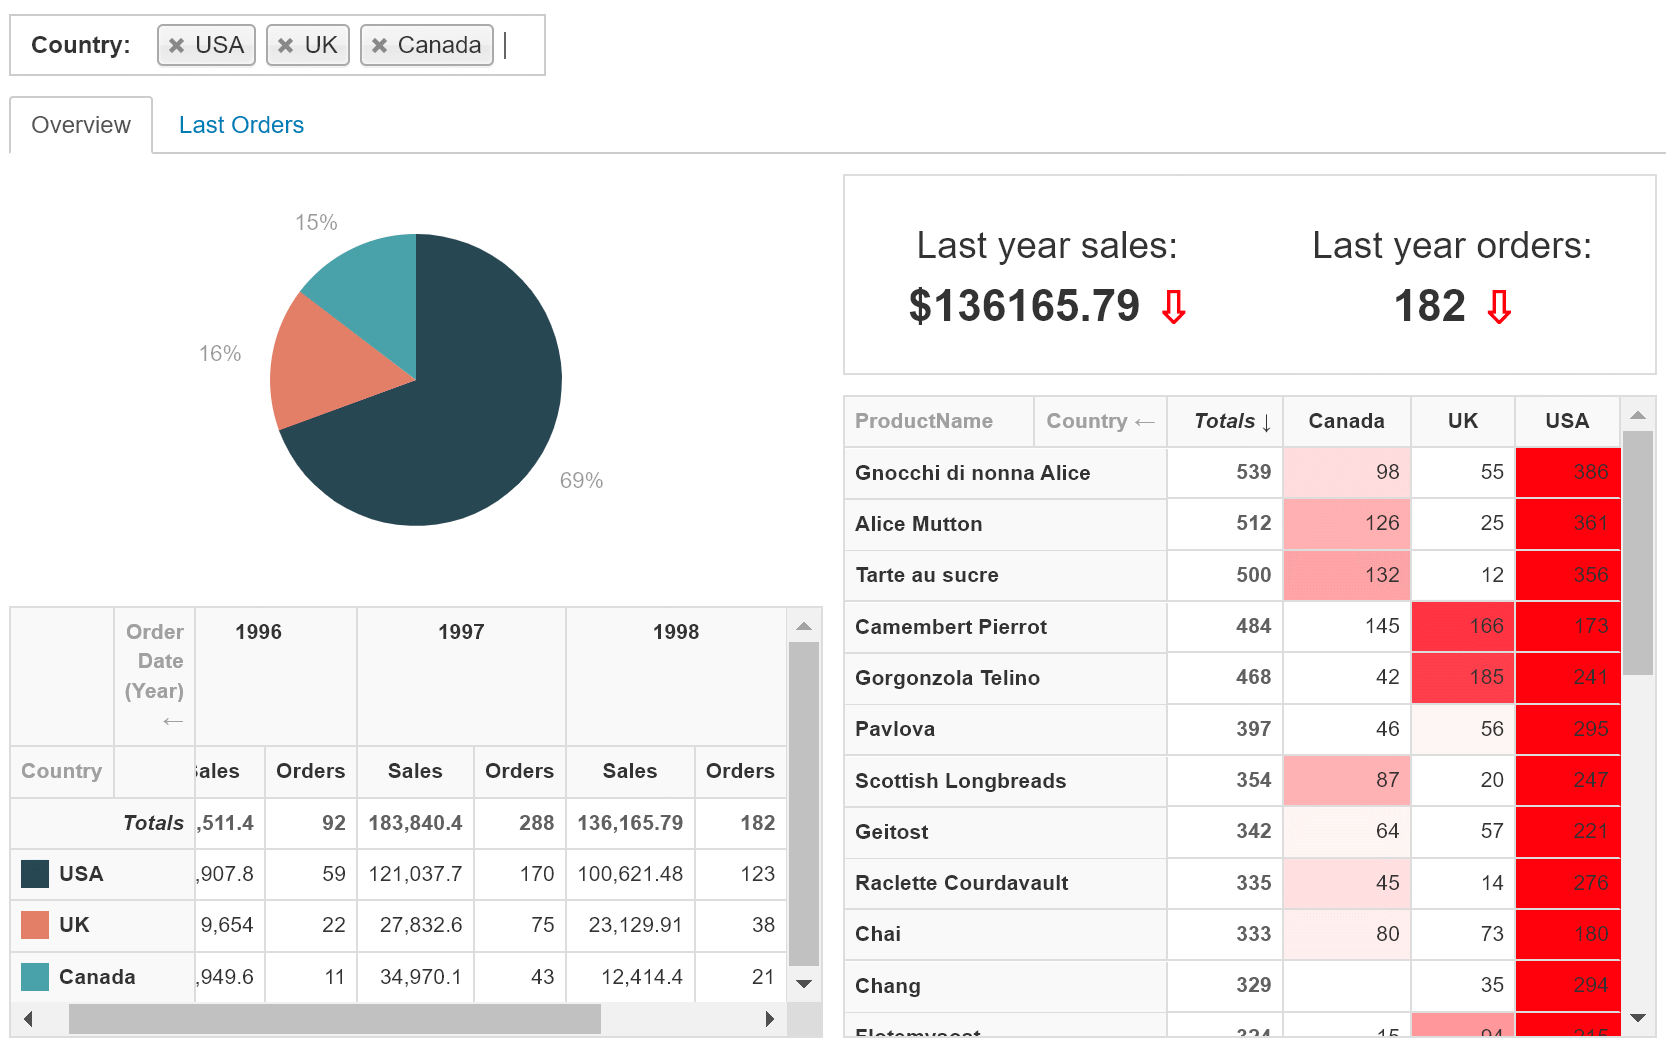
- Report (data visualization): a placeholder for the saved or inline-configured report. It is possible to specify your own rendering JS function for a custom visual; in this case only report's JSON export is loaded.
- Parameter (filtering control): this could be a parameter defined in the existing cube, or a parameter defined specially for this dashboard. Flexible cross-filtering is supported.
You can use any HTML tags inside the template and reference external CSS/JS, place <script> blocks with your own JS code snippets.
Dashboards may be shared to other users (with "Team Sharing") and published/embedded (with "Advanced publishing") in the same way as reports.
At this time, dashboards are only available for on-premise SeekTable installations (can be evaluated on seektable.com upon request).
Report Widget
Widget:Report tag defines a placeholder for the report. Inside this tag widget options are configured via JSON.
ReportId.
<Widget:Report>{
  "ReportId": "report_id",
  "ApplyParameters" : {
    "dashboard_param" : "report_param"
  },
  "SetParameterValues" : {
    "report_param" : "value"
  },
  "ChartLegendPosition": "right",
  "ClientWidgetName" : "myReport"
}</Widget:Report>
CubeId, ReportType, ReportConfig.
<Widget:Report>{
  "CubeId": "cube_id",
  "ReportType": "pivot",
  "ReportConfig": {
    "Rows": [ {"Name": "dim_year"} ],
    "Measures": [ {"Name": "Count"} ]
  },
  "ApplyParameters" : {
    "dashboard_param" : "report_param"
  }
}</Widget:Report>
Inline report is useful when you need to display some data without saving it first in the app.
| JSON option | Type | Description |
|---|---|---|
ReportId |
string | ID of the report (if this widget displays an existing report). This ID can be found in the address bar when the report is opened in the app. |
CubeId |
string | Only for inline reports: ID of the cube. This ID can be found in the address bar when the cube is opened in the app. |
ReportType |
string | Only for inline reports: pivot (aggregated data) or table (records data). |
ReportConfig |
object | Only for inline reports: JSON configuration of the report. You can get this configuration from the existing report in this way: go to "Manage Account" and download account data backup (use zip format to get configs in a separate files), then locate the report in this data to get its config. Alternatively, you can use SeekTable's reporting engine API reference to write this config manually. |
ApplyParameters |
object | Determines which dashboard parameters should affect this report and how they should be mapped to report's parameters:
{
  "start_date": "order_start_date"
}
If dashboard parameters are referenced from report's cube they are applied automatically (no need to specify them explicitely).
|
SetParameterValues |
object | Hardcoded parameter values for this report (these values override user input). For example: {"filter_year":2022} |
ChartOnly |
bool | Hides pivot table to display only the chart. Applicable only for pivot reports with a chart. |
ChartLegendPosition |
string | The position where to display chart's legend: right, top, bottom.
Applicable only for pivot reports with a chart.
|
TableOnly |
bool | Hide a chart to display only a table. Applicable only for pivot reports with a chart. |
Static |
bool | Render only static table's HTML without any interactivity (no fixed headers/pager/sort/expand-collapse). |
Disabled |
bool | Disable (do not render) this report widget both for web view and exports. Useful when you need to exclude certain report in the embeded dashboard via JWT claim (see Replace JWT payload variables in HTML option). |
NoCache |
bool | Ignore cached data (if present) to guarantee that displayed values are 100% up-to-date (short-living in-memory cache is used by default for pivots). |
DashboardExport |
object |
When dashboard export is enabled you may specify these options:
{
  Pdf: false, // exclude this report from dashboard's PDF export
  Excel: false,  // exclude this report from dashboard's Excel export
  ExcelWorksheetName: "Sheet1",  // custom worksheet's name
  ExportAllData: true // ignore limits/pager, export all data
}
Note: ExportAllData is anyway has a 50k limit.
For on-prem SeekTable deployments, this limit can be extended (see SeekTable_ST__Export__ |
ReportOverride |
object |
Can be used to override some report configuration properties like ExportAllData, LimitRows,
LimitColumns (pivot only), RowPage (pivot only), ColumnPage (pivot only), OffsetRows (flat only).
How to change paginated pivot table's page size for rows (15 rows per page): {"RowPage": {"Limit":15, "Offset":0}
How to change paginated flat table's page size (20 rows per page):
{ "LimitRows": 20 }
|
ClientWidgetName |
string | Optional name for this widget. To get the report's JSON export data in your custom JS code, use this name:
Dashboard.loadReportJsonData("clientWidgetName", function(res) {
  var jsonExportData = res.reportData; // report's JSON export
  var chartData = res.getChartData(); // JSON with series
}, false);
The callback can be invoked each time when report changes if 3rd (optional) parameter is true - this is useful if you have something in your dashboard that should be in sync with the report.
|
ClientCustomRenderFunction |
string | The name of the global JS function that renders a custom visual. Widget's placeholder element and report's data are passed in the 1st argument:
window.myCustomVisual = function(context) {
  var jsonExportData = res.reportData; // report's JSON export
  var chartData = res.getChartData(); // JSON with series
  context.$el.html( JSON.stringify( chartData ) );
};
|
ClientCustomRenderReportDataFormat |
string | An export format for the 'reportData' passed to the custom render function (optional).
Can be json, raw_json (to return tabular JSON of aggregated data, only for pivot reports), csv, html.
|
Parameter Widget
Widget:Parameter tag defines a placeholder for the parameter (an UI filter control). This tag contains a JSON with options.
Dashboard parameters are 'global' in meaning that they may affect all reports (visuals) of that dashboard (cross-filtering).
You can explicitely control how dashboard parameters are applied (mapped) to concerte reports via widget's ApplyParameters config option.
CubeId and ParameterName:<Widget:Parameter>{
"CubeId":"cubeId",
"ParameterName": "cubeParamName",
"Label": "Parameter Label",
"Value":null
}</Widget:Parameter>
When parameter widget references cube's parameter it automatically affects all reports based on that cube.
To apply it as a cross-filter for reports based on another cubes this parameter should be explicitely specified in ApplyParameters of appropriate report widgets.
ParameterName and Editor:<Widget:Parameter>{
"ParameterName": "year",
"Value":1997, // initial value
"Editor": {
"Control":"DropdownDynamic",
"DropdownCubeId": "cubeIdForDropdownItems",
"DropdownValueDimension": "order_date_year",
"DropdownTextDimension": "order_date_year",
}
}</Widget:Parameter>
Important: to apply this custom parameter it should be specified in report widgets ApplyParameters explicitely.
| JSON option | Description |
|---|---|
ParameterName |
The name of the parameter. |
CubeId |
Id of the cube with the specified parameter. It can be found in the address bar when cube is opened. |
Value |
Initial value for the parameter in this dashboard. |
Label |
The label for the parameter. |
DataType |
A type for parameter's value (not applicable if CubeId is set). Possible values are: String (default), Int32, Int64, Decimal, DateTime, Boolean. |
Multivalue |
Determines whether this parameter can hold multiple values (not applicable if CubeId is set). |
Editor |
UI control configuration for this parameter (not applicable if CubeId is set). Editor's options:
|
ClientCustomRenderFunction |
The name of the global JS function that renders a custom parameter's editor:
window.myCustomParameterEditor = function(context, onChangeHandler) {
  console.log(context);
  var dropdownItems = context.DropdownValues;

  $('#myCustomInput').change(function() {
    var newValue = $(this).val();
    // when editor's selection is changed
    onChangeHanlder( newValue );
  });

  // optional: return a function that sets a new value to this editor
  // without this function dashboard will re-render editor each time
  // when parameter's value is changed (outside of this editor).
  return function(setVal) {
    $('#myCustomInput').val(setVal);
  };
};
|
Filter button
By default report parameters are applied on change: immediately after user's selection. This behaviour eliminates the need to have a special "Filter" button that applies changed parameters. However, if you have many parameters on your dashboard each change causes widgets to refresh which may be undesired. In cases like that it is possible to disable automatic refresh when parameters are changed, and apply them explicitly - via special "Filter" button (or JS code):
- Choose "Apply parameters: Filter button" mode (the dropdown below HTML template textarea)
- Add a filter button into HTML Template:
<a href="javascript:;" class="stFilterButton stFilterApply">Filter</a>
- Alternatively, changed parameters may be applied via JS API:
Dashboard.applyChangedParameters();
Predefined CSS classes
Typical layouts are supported with the following predefined CSS classes:
stFilter- Used for div that wraps placeholders for dashboard parameters.
w100,w75,w66,w50,w33,w25- Used for report's wrapping div to specify the width in % (w100 = 100%, w50 = 50% etc).
h100,h75,h66,h50,h33,h25- Used for report's wrapping div to specify the height in % (h100 = 100%, h50 = 50% etc). The height value is calculated with JS code; 100% height corresponds to the page's free space excluding elements with classes "h<value>".
ul.tabs-
Built-in tabs with lazy-load of reports inside tabs content. Tabs are useful for dashboards with many reports. For example:
<ul class="tabs"> <li class="active"><a href="#tab_overview">Overview</a></li> <li><a href="#tab_by_items">By items</a></li> </ul> <div id="tab_overview"> <div class="w50 h100"> <!-- report widget here --> </div> <div class="w50 h100"> <!-- report widget here --> </div> </div> <div id="tab_by_items"> <div class="w100 h100"> <!-- report widget here --> </div> </div> a.stExportButton- A built-in style and handler for the export button:
<a href="#" class="stExportButton" data-report="reportClientWidgetName" data-format="exportFormat" data-loadingspinner="true">ButtonText</a>
In additionstSmallButtonCSS class may be added to make button smaller. a.stFilterResetButton- A built-in style and handler for the filter reset button:
<a href="#" class="stFilterResetButton" >Reset</a>
In additionstSmallButtonCSS class may be added to make button smaller.
Alternatively, you may reset parameters via JS API:Dashboard.resetParameters();
Report Widget Export
It is possible to initiate an export for the concrete report widget in this way:
Dashboard.getReportByName('clientWidgetName').publishedReport.export('format', callbackFunc)
- clientWidgetName
- value of
ClientWidgetNamefrom widget's JSON definition. - format
pdf,csv,excel,excelpivottable(can be used only for exporting pivot table reports),html,json,png(image).- callbackFunc
- An optional function that is called when export is completed; it can be used to hide some kind of 'loading' indicator, for instance.
Export link example:
<a href="javascript:;" onclick="Dashboard.getReportByName('clientWidgetName').publishedReport.export('pdf')">Export to PDF</a>
Alternatively you can place a button (or link) with stExportButton class to use a built-in export handler:
<a href="#" class="stExportButton stSmallButton"
    data-report="clientWidgetName" data-format="pdf" data-loadingspinner="true">PDF</a>
Dashboard Export
You may enable 'all-dashboard' export when multiple reports are exported into a one file. The following formats are supported for this kind of export:
- Excel: each report widget is exported to a separate Excel worksheet. You may control which report widgets are exported and specify custom worksheet names for each report widget separately.
- PDF: this kind of export uses dasboard's "HTML Template" that can contain special 'print' CSS rules that adopt the layout for PDF generation purposes.
SeekTable generates PDFs using wkhtmltopdf by default (which behaves like a legacy web browser). For on-prem SeekTable installations it is possible to use an alternative Chromium-based engine.
You may control which report widgets are exported.
Please consider the following limitations:- Do not use modern CSS3 layout (grid/flex) and ES2015+ javascript syntax [until Chromium-based PDF exports are configured].
- By default report widgets with custom renderers are included into PDF. Don't forget to exclude custom visuals that cannot be rendered by wkhtmltopdf (via widget's "DashboardExport" options).
- You may apply PDF-specific CSS rules by using
body.stPdfExportselector, for example:<style> .myHeading { display:none; font-size:20px; } body.stPdfExport .myHeading { display:block; } </style> <div class="myHeading">Report title only for PDF</div>JS snippets also can have PDF-specific code:if ($("body").hasClass("stPdfExport") { /* PDF-specific code */ } - It is possible to customize PDF page size and orientation by including special
<style>tag:<style> @page { size: A4 landscape; // size: 210mm 297mm portrait; // size: landscape; margin-left: 5mm; margin-right: 5mm; } </style>Note that only these@pageproperties are supported. Numbers can be in "mm" or "in".
When the dashboard export is enabled, it can be initiated programmatically via JS code:
Dashboard.exportDashboard('format', callbackFunc)
- format
- Currently this can be only
excel. - callbackFunc
- An optional function that is called when export is completed; it can be used to hide some kind of custom 'loading' indicator, for instance.
Alternatively you can place a button (or link) with stExportButton class to use a built-in export handler:
<a href="#" class="stExportButton stSmallButton" data-format="excel" data-loadingspinner="true">Download All (Excel)</a>
Custom visual
You can implement custom rendering of report's data in this way:
<Widget:Report>{
  "ReportId":"<pivotReportIdToLoadDataFrom>",
  "ClientCustomRenderFunction": "myCustomVisual"
}</Widget:Report>
<script>
function myCustomVisual(context) {
  if (context.error) {
    alert(context.error);
    return;
  }
  // simply display a grand total value
  context.$el.html("<center style='font-size:22px;'>"+ context.reportData.GrandTotal+"</center>");
  // how to access report's data
  console.log(context.reportData);
  // how to get report's data transformed into chart series (only for pivot report)
  console.log(context.getChartData());
}
</script>
Render function is called when visual needs to be displayed; context contains the following properties:
$el- jQuery element of the report's placeholder div-container. A native DOM element is
$el[0]. error- If present and non-null indicates data load error. In this case, other properties ('reportData', 'getChartData') are null. Always check this property before accessing report's data to make sure that data is loaded successfully.
reportData- JSON export of the report (by default). The structure depends on the report type (pivot table or flat table).
This can be CSV or 'raw' JSON data if
ClientCustomRenderReportDataFormatis specified. getChartData()- The function that returns pivot data in the form of chart series (applicable only for pivot-table reports).
Report Table Customization
It is possible to run some JS code each time when concrete report widget's table is rendered.
This is useful when you want to apply custom UI or modifications only to exact table's cells
(to determine these cells custom HTML formatting can be used to wrap them with a special <div>),
for example:
<div class="w100 h100">
<Widget:Report>{"ReportId":"REPORT_ID", "ClientWidgetName" : "myReport"}</Widget:Report>
</div>
<script type="text/javascript">
$(function() {
  var reportContainerId = Dashboard.getReportByName("myReport").widgetContainerId;
  var $reportContainer = $("#"+reportContainerId);
  var handleCells = function() {
    $reportContainer.find(".markerCssClass").each( function() {
      var $cellHolder = $(this);
      // do something with marked cells
    });
  };
  $reportContainer.on("widgetTableRender", handleCells);
});
</script>
Embed dashboards
To embed a dashboard it is enough to enable a public link and then use this link inside iFrame. It is possible to restrict access to dashboard's public link:
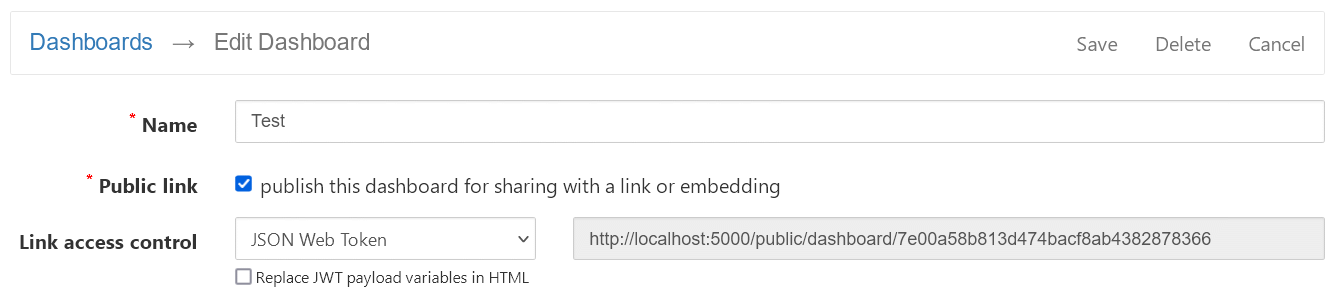
When Replace JWT payload variables in HTML option is enabled you can pass variables in JWT payload and use them in dashboard's HTML Template, for example:
<p>This is a dashboard. Hello, @varName!</p>
Variable placeholder's syntax is the same as for report parameters in cubes:
@- identifies that this is a placeholder for the parameter
varName- variable name that corresponds to a claim name in the JWT payload. Should start with a letter and contain only alphanumerics or '_'.
[prefix{0}suffix]- optional template which specifies what should be inserted into HTML template.
A content between square brackets is used when variable is defined and
{0}is replaced with actual variable's value.
You may define an alternative content that is used when variable is not defined in this way:@varName[{0};not_defined_value]
Variables are placed into HTML Template as-is; this means that you can use them inside widgets (for instance, to resolve cubes/reports IDs) and even pass raw HTML/JS code in JWT payload.
Important:
If your dashboard template contains @ symbols (that are not used for variable's placeholders) they should be
escaped as @@ (they will be replaced to single @).