Cohort Analysis with SeekTable
Cohort analysis is used for getting insights about specific users (or another kind of actors) behaviour when they are grouped in cohorts by some criteria. This kind of analytics is performed with dataset represents a history of some events; this might be page views statistics or transactions (say, purchases) or user actions log. Typically cohort analysis is used for:
- Retention analysis: to measure customers retention rates over time. By tracking cohorts, you can see how many customers from each cohort continue to engage with your product or service over weeks, months, or even years. This helps you identify trends in customer churn and assess the effectiveness of your retention strategies.
- Behavior analysis: to get insights how different groups of customers behave after their initial interaction with your app or business process.
- Feature adoption: to understand how quickly different user segments adopt new features, products, or updates.
To perform cohort analysis on input you need to have a dataset with the following columns:
- unique user identifier, like
user_id - properties needed to determine user cohort, like
create_dateorregistration_date - date of the event performed by the user, like
event_date
This article describes how to use SeekTable for cohort analysis and create user retention report (like in Google Analytics).
Online demo for this kind of report: user retention report sample.
CSV data source
Lets assume that our history data is represented by user_events.csv file. After file upload SeekTable automatically suggests "year" and "month" dimensions for date columns:
- "Reg Date (Year)" and "Reg Date (Month)" for the user's registration date
- "Event Date (Year)" and "Event Date (Month)" for the event date
To perform cohort analysis we need to add one custom dimension to calculate number of months (this may be days or weeks) between event data and registration date (Cube → Edit Configuration). For this purpose "Expression" type of dimension can be used:
| Type | Name | Label | Format | Parameters |
|---|---|---|---|---|
Expression |
month_from_reg |
Months from Reg Date |
|
In dimension with type="Expression" 1-st parameter is a formula expression, and next N parameters are names of dimensions that are used as arguments of the formula. See also reference on calculated fields for more details on this topic.
Then let's add a measure that counts number of unique users inside groups:
| Type | Parameters | Name | Label |
|---|---|---|---|
CountUnique |
user_id |
CountUniqueOfUserID |
Count Unique Users |
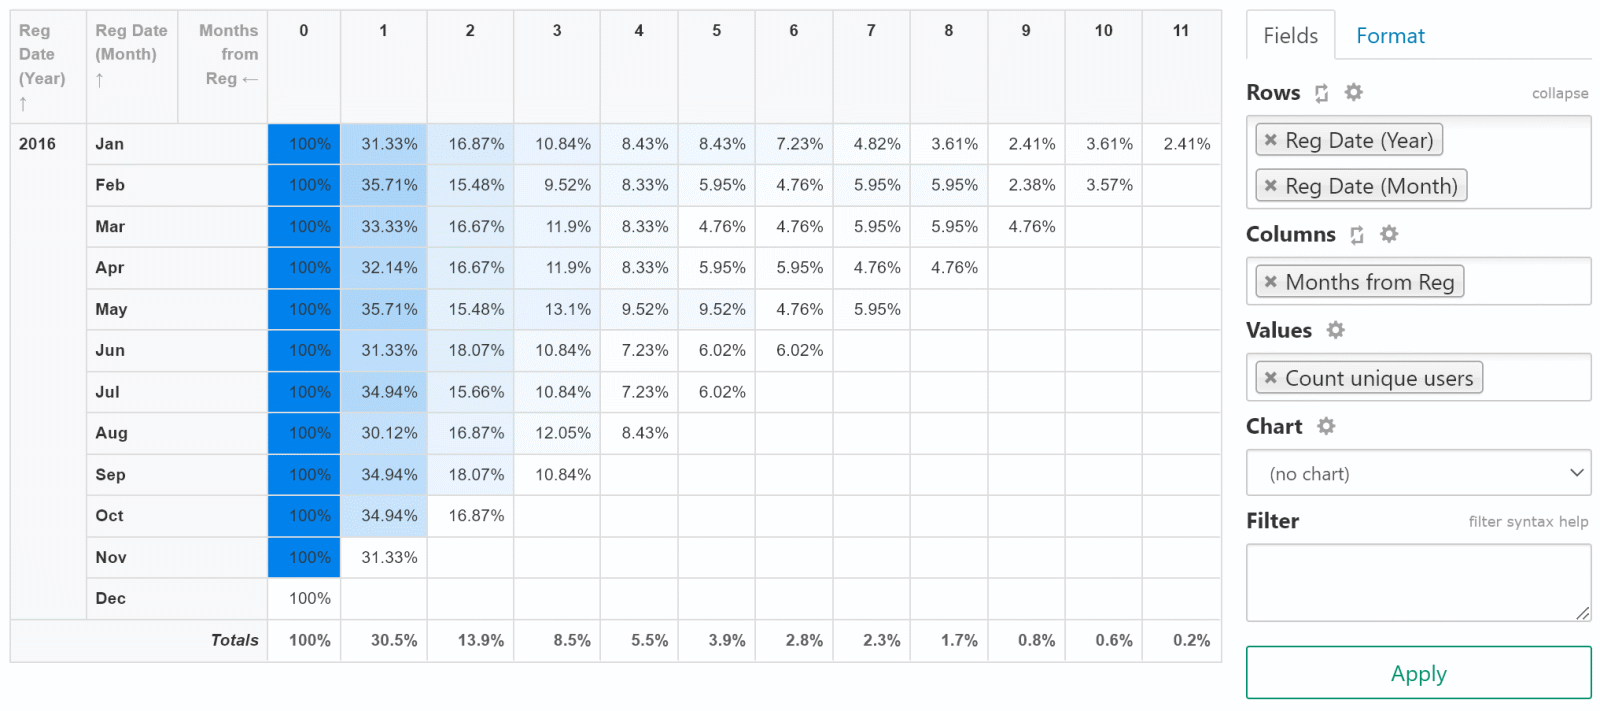
Now we can configure user retention by month report:
- select "Reg Date (Year)" and "Reg Date (Month)" for rows
- select "Months from Reg Date" for columns
- select "Count Unique Users" for values
- click "Apply", you should see a report like this.
You can use options from "Format" tab to make your user retention report like in Google Analytics:
- Value calculations: select
% of row - Heatmap: select
By Row - Totals: uncheck
Grand TotalandColumn Totals
Now you have basic cohort report; you can use another dimensions on columns to change cohort criteria; also you can change the formula and user another period instead of month - say, a day or quarter.
SQL data source
In case of SQL database all steps are the same as for CSV, only difference is that instead of
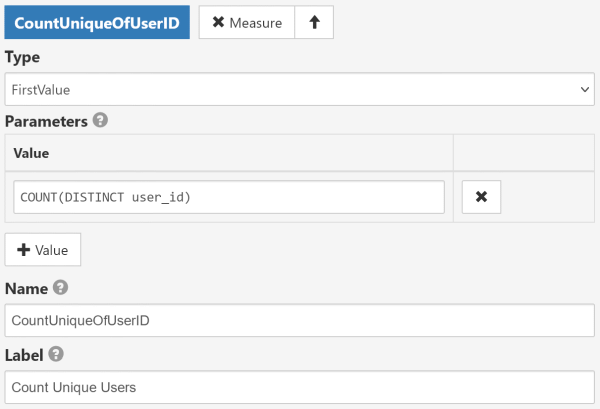
CountUnique measure type (which is available only for CSV cubes) you need to configure custom measure based on SQL COUNT(DISTINCT):
- Type:
FirstValue - Parameters:
COUNT(DISTINCT user_id) - Name:
CountUniqueOfUserID - Label:
Count Unique Users
In the case of SQL data source it makes sense to calculate number of months (weeks, days) between an event and a registration date on SQL level,
without usage of Expression-type dimension for month_from_reg. For example:
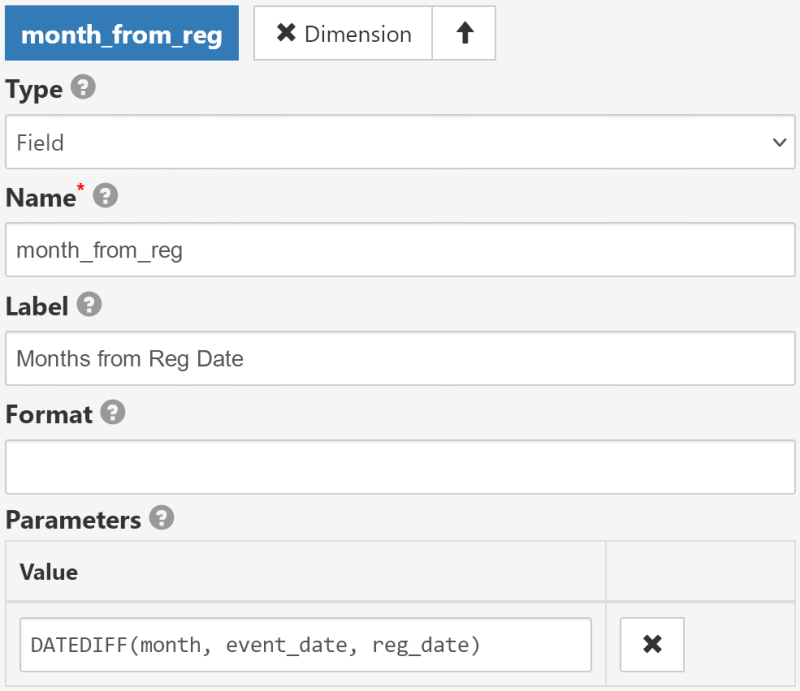
- Type:
Field - Name:
month_from_reg - Label:
Months from Reg Date - Parameters: an SQL expression that calculates the difference in months
- SQL Server:
DATEDIFF(month, event_date, reg_date) - MySql:
TIMESTAMPDIFF(MONTH, event_date, reg_date) - PostgreSql:
(DATE_PART('year', reg_date::date) - DATE_PART('year', event_date::date))*12 + DATE_PART('month', reg_date::date) - DATE_PART('month', event_date::date)
- SQL Server: