Setup self-service reporting & ad-hoc analytics
SeekTable is good for data exploration and ad-hoc reporting and can be used even by non-IT users. It is easy to create, save, export and share reports that are based on your CSV data or connected to a database. Supported visualizations are:
- a pivot table (crosstab): this is a summary report that shows the intersection of different categories and helps to identify patterns and trends.
- a pivot chart: summarized data visualization as a chart like bar / horizontal bar, stacked bar, line, scatter, area, pie / donut
- a flat table (datagrid): a table that displays selected columns of dataset's rows (that may be filtered, re-ordered)
SeekTable can be used for a managed self-service BI scenario when data sources and models (cubes) are maintained by the IT team and users consume them to create their own reports in a controlled way, without having a direct access to the data sources.
Connect to Data
All data visualizations come from the underlying dataset. You can use SeekTable with the following data sources:
- CSV/TSV/Excel file
-
Click the "Upload Data" button, choose a file on your computer you want to upload and - that's all.
SeekTable automatically determines the columns and configures them as a cube dimensions and measures; you can customize default CSV cube setup later if needed.- First row with column headers is required.
- Supported separators: comma, tab, semicolon, colon, pipe. Separator and file encoding are determined automatically.
- No limits on the number of rows or columns. Max file size upload limit: 50Mb.
- File may be compressed with zip (".zip" extension) or gzip (".gz" extension) - this allows you to upload even large CSV files (up to 500mb).
- Sample CSV file: sales.csv.
- Excel files (
.xls/.xlsx/.xlsb/.ods): supported, max file size is 5Mb. If you have larger Excel file you can save the worksheet as CSV. - Numbers 3.0+ / iWork 2013+ Spreadsheets (
.numbers): supported, max file size is 5Mb. - dBASE II/III/IV / Visual FoxPro (
.dbf): supported, max file size is 5Mb.
- Database
-
Click "Connect to Database" and choose your database type, then configure the connection. Your database should allow connections from SeekTable server (34.210.10.23).
If your database cannot be accessed from the internet you can consider usage of self-hosted SeekTable version.
Supported databases:- SQL Server (Azure SQL)
- MySql + protocol-compatible databases (MariaDB, SingleStore, MindsDB)
- PostgreSql + protocol-compatible databases (Amazon Redshift, TimescaleDB, QuestDB, cube.js)
- Oracle Database
- Google BigQuery
- Snowflake
- ClickHouse
- PrestoDB/Trino
- DuckDBon-prem version only / MotherDuck
- Teradata
- Databricks
- SAP HANA
- MongoDb + protocol compatible databases (Azure Cosmos DB, Amazon DocumentDB)
- ElasticSearch (OpenSearch)
- XMLA OLAP server (SQL Server Analysis Services, icCube)
- Custom connector (web API) for any other kind of data source.
All queries are performed on-the-fly (without data import) and nothing is stored on SeekTable server (except short-living in-memory cache). You can use SeekTable with a database of any size.
Note: aggregated data for summary reports (pivot tables/charts) is cached in-memory for the short periods of time. Cloud SeekTable cache settings are (can be customized in self-hosted version):
- Sliding expiration: 2 minutes
- Absolute expiration: 10 minutes
- Cache flushes each time when cube configuration form is saved
Create reports
Once data source data source ("cube") is configured you can create your first report:
- Click "New Report" or "+" icon in the left menu.
-
Choose desired report type:
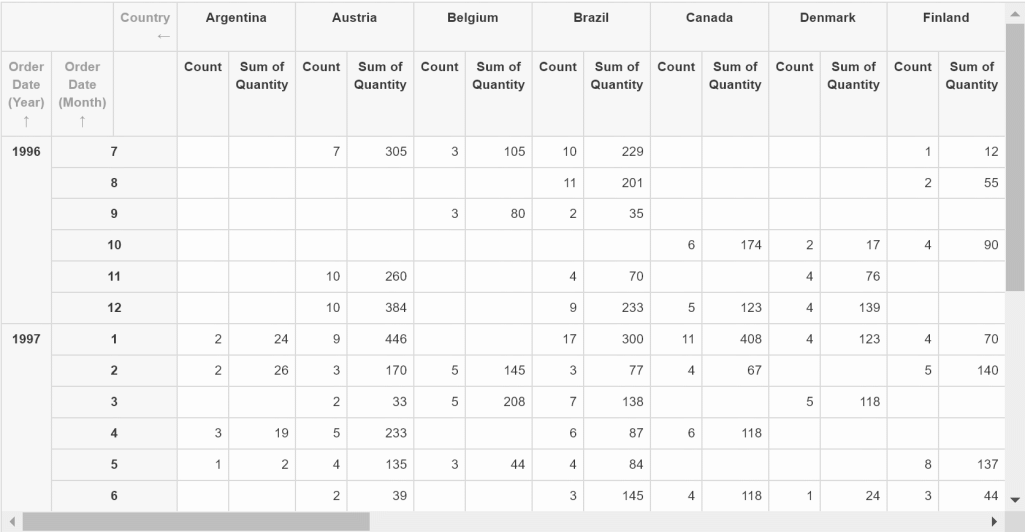
- Pivot table
- Cross-tab (summary) report that displays aggregated data.
Use this report type to build a chart. - Flat table
- Grid that displays dataset rows 'as is'.
-
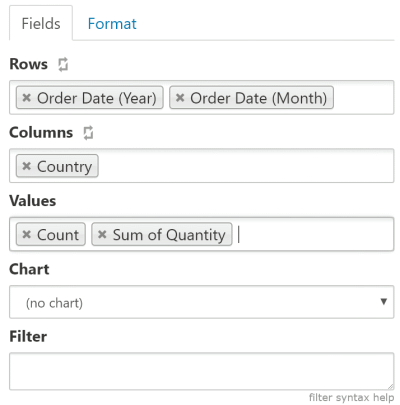
In case of Pivot table report:
- Select dimensions that you want to see as "Rows" and "Columns". Empty list is ok.
- Select measure(s) that should be displayed in table cells. If no measures selected, "Count" is used by default.
- Optional: choose Chart type if you want to get pivot chart visualization in addition to the pivot table.
-
In case of Flat table report:
- Select "Columns" to display. At least one column should be selected.
- Click "Apply".
See also create pivot table how-to to get more details on the report creation (filter/sort/drill-down etc).
Save and Share Your Insights
- To save a report click the "New Report" label and enter the name of the report.
-
"Export" menu allows you to export the report to the following formats:
- CSV
- Excel (worksheet with tabular data + preconfigured Excel Chart)
- Excel PivotTable (pivot table reports only)
- Report can be shared:
- with "Share by Email" function report (snapshot) may be delivered as email.
- with "Get Link" you can allow people to view your saved report. This function can be used for embedding the report into other website or webapp.
- with "Share to team" function report can be shared with other SeekTable users.
Have questions?
Communicate with SeekTable support team, ask questions and share your feedback: support@seektable.com